Is My PostgreSQL Database Read or Write Heavy?

Many data infrastructure decisions hinge on how much write vs read workload the database is handling. Decisions such as how much to invest in caching, how to size your read replicas, and whether to spend more time turning queries and indexes?
When you start out, it’s easy to raw-dog these decisions and make them based on your intuition, but over time, knowing where your database load is coming from helps make better decisions.
There are a few ways to get this information.
Tuple Counting
pg_stat_database is a view that is present as part of the PostgreSQL statistics system and provides database-wide statistics for each database. Among other stats, it tracks the number of tuples (rows) affected by queries in the database. These stats include:
tup_returned: This is the number of tuples that were read/scanned during the query execution.tup_fetched: This is the number of tuples (out of the tup_returned) that were eventually sent to the client. Essentially, havingtup_returnedbeing magnitudes higher thantup_fetchedsignals that we are looking up way more rows than we need.tup_inserted: Number of tuples that have been inserted into the database. Each value in an insert query increments thetup_inserted(e.g.,INSERT INTO table VALUES (1, 'a'), (2, 'b'), (3, 'c');increments the tup_inserted by 3).tup_updated: Total number of row modified by UPDATE statements in the database.tup_deleted: Total number of rows that have been deleted (marked as unavailable) in the database.
We can then query these stats to get an idea of the ratio between our write vs read queries, like this:
SELECT
datname,
tup_returned as reads,
tup_inserted + tup_updated + tup_deleted as writes,
ROUND(
(tup_inserted + tup_updated + tup_deleted)::numeric /
NULLIF(tup_returned + tup_inserted + tup_updated + tup_deleted, 0) * 100, 2
) as write_percentage
FROM pg_stat_database
WHERE datname = 'db_name';
Here’s what the results look like from an example database:
datname    |reads        |writes    |write_percentage|
-----------+-------------+----------+----------------+
db_name    |4118071153065|1299189510|            0.03|
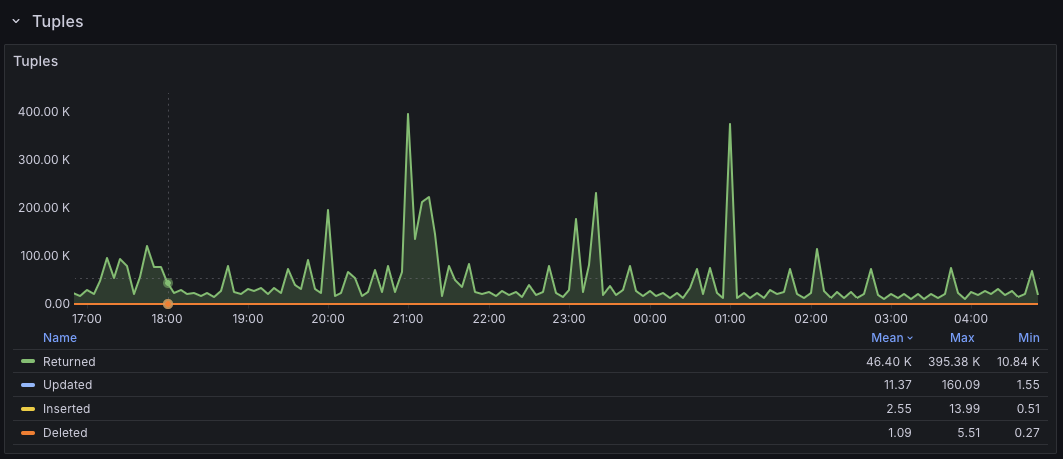
If you use PMM, the Postgres Instance Summary also has a friendly Tuples panel that surfaces these tuple metrics in a nice visualization.
Per-Table Stats
PostgreSQL also maintains table statistics in a separate pg_stat_user_tables view. If we’re trying to understand the read vs write ratio at a table level, we can extract that with a query similar to the one below:
SELECT schemaname,
relname,
seq_scan + idx_scan as total_reads,
n_tup_ins + n_tup_upd + n_tup_del as total_writes,
ROUND(
(n_tup_ins + n_tup_upd + n_tup_del)::numeric /
(seq_scan + idx_scan + n_tup_ins + n_tup_upd + n_tup_del) * 100, 2
)::text || '% writes' as workload
FROM pg_stat_user_tables
ORDER BY (seq_scan + idx_scan + n_tup_ins + n_tup_upd + n_tup_del) DESC;
The query here is similar to the one from the database stats view since we still treat inserts, updates, and deletions (n_tup_ins, n_tup_upd, and n_tup_del) as writes. The difference is that now, we are relying on raw index and sequential scans to know the number of reads happening on the table.
Here’s what the results look like:
schemaname|relname         |total_reads|total_writes|workload     |
----------+----------------+-----------+------------+-------------+
public    |users           | 6642435893|      925183|0.01% writes |
public    |email_otps      |    2804956|      756354|21.24% writes|
public    |admin_actions   |        204|        5854|96.63% writes|
public    |webhook_payloads|    1292810|     6354517|83.09% writes|
The above helps to understand data volume, but there’s a different perspective.
Tuples don’t necessarily map to actual query patterns. Instead, they represent row-level activity. To simplify this, imagine you have a SELECT statement that sends back 1000 rows to your application - such a statement will increment the tup_fetched by 1000, i.e., we eventually got 1000 rows after all the scans and filtering, but we only executed a single SELECT query. To understand query-level activity, it’s better to reach for tools like pg_stat_statements.
pg_stat_statements
This is a PostgreSQL extension that helps track query statistics across all queries running on the PostgreSQL server. Because it’s an extension, it needs to be enabled separately.
With pgss enabled, we can run the following query to get a sense of our query patterns:
SELECT
    CASE
        WHEN query ILIKE 'select%' THEN 'READ'
        WHEN query ILIKE 'insert%' THEN 'INSERT'
        WHEN query ILIKE 'update%' THEN 'UPDATE'
        WHEN query ILIKE 'delete%' THEN 'DELETE'
        WHEN query ILIKE 'with%' AND query ILIKE '%select%' THEN 'READ'
        WHEN query ILIKE 'declare%cursor%' THEN 'CURSOR_DECLARE'
        WHEN query ILIKE 'fetch%' THEN 'CURSOR_FETCH'
        WHEN query ILIKE 'close%' THEN 'CURSOR_CLOSE'
        ELSE 'OTHER'
    END as operation_type,
    COUNT(*) as query_count,
    ROUND((COUNT(*) * 100.0 / SUM(COUNT(*)) OVER ())::numeric, 2) as query_count_pct,
    SUM(calls) as total_calls,
    ROUND((SUM(calls) * 100.0 / SUM(SUM(calls)) OVER ())::numeric, 2) as total_calls_pct,
    ROUND(SUM(total_exec_time)::numeric, 2) as total_time_ms,
    ROUND((SUM(total_exec_time) * 100.0 / SUM(SUM(total_exec_time)) OVER ())::numeric, 2) as total_time_pct,
    ROUND(AVG(mean_exec_time)::numeric, 2) as avg_time_ms
FROM pg_stat_statements
GROUP BY operation_type
ORDER BY total_calls DESC;
Here, we match the usual CRUD query types, but in addition, we also match for large data export jobs (e.g., the cursor fetches used by Metabase), which are still READs anyway.
A sample output from the query above looks like this:
operation_type|query_count|query_count_pct|total_calls|total_calls_pct|total_time_ms|total_time_pct|avg_time_ms|
--------------+-----------+---------------+-----------+---------------+-------------+--------------+-----------+
READ          |        587|          11.82| 1162278051|          48.21| 217822781.16|         63.14|       2.93|
INSERT        |         48|           0.97|  750048671|          31.11|  80178635.13|         23.24|       0.45|
OTHER         |         75|           1.51|  261711469|          10.85|   1798937.73|          0.52|       3.88|
UPDATE        |         71|           1.43|  188038666|           7.80|  23942530.45|          6.94|       1.27|
DELETE        |         10|           0.20|   48620934|           2.02|  21250825.48|          6.16|       4.64|
CURSOR_FETCH  |       4154|          83.62|     399101|           0.02|      4538.76|          0.00|       0.01|
CURSOR_DECLARE|         23|           0.46|         23|           0.00|         4.90|          0.00|       0.21|
The “OTHER” group can also offer some insights, though. For example, they could track BEGIN/ROLLBACK/COMMIT calls for transactions.
The database is usually the first bottleneck as soon as you have an app that starts to matter, and it’s interesting how understanding how your applications are interacting with it gives you ideas on how to improve/navigate said bottlenecks.
PS: Thanks to Google’s nano-banana for one-shotting the cover image from a single prompt.